The Challenge (Situation & Task) Despite a saturated fitness app market, high churn rates persist. Most apps fail by burdening users with complex data entry during intense workouts. My goal was to design a frictionless tracking system that maintains training momentum and boosts long-term engagement.
90% ↑
Completion Rate In usability testing
4.5 / 5
Satisfaction User ease-of-use rating
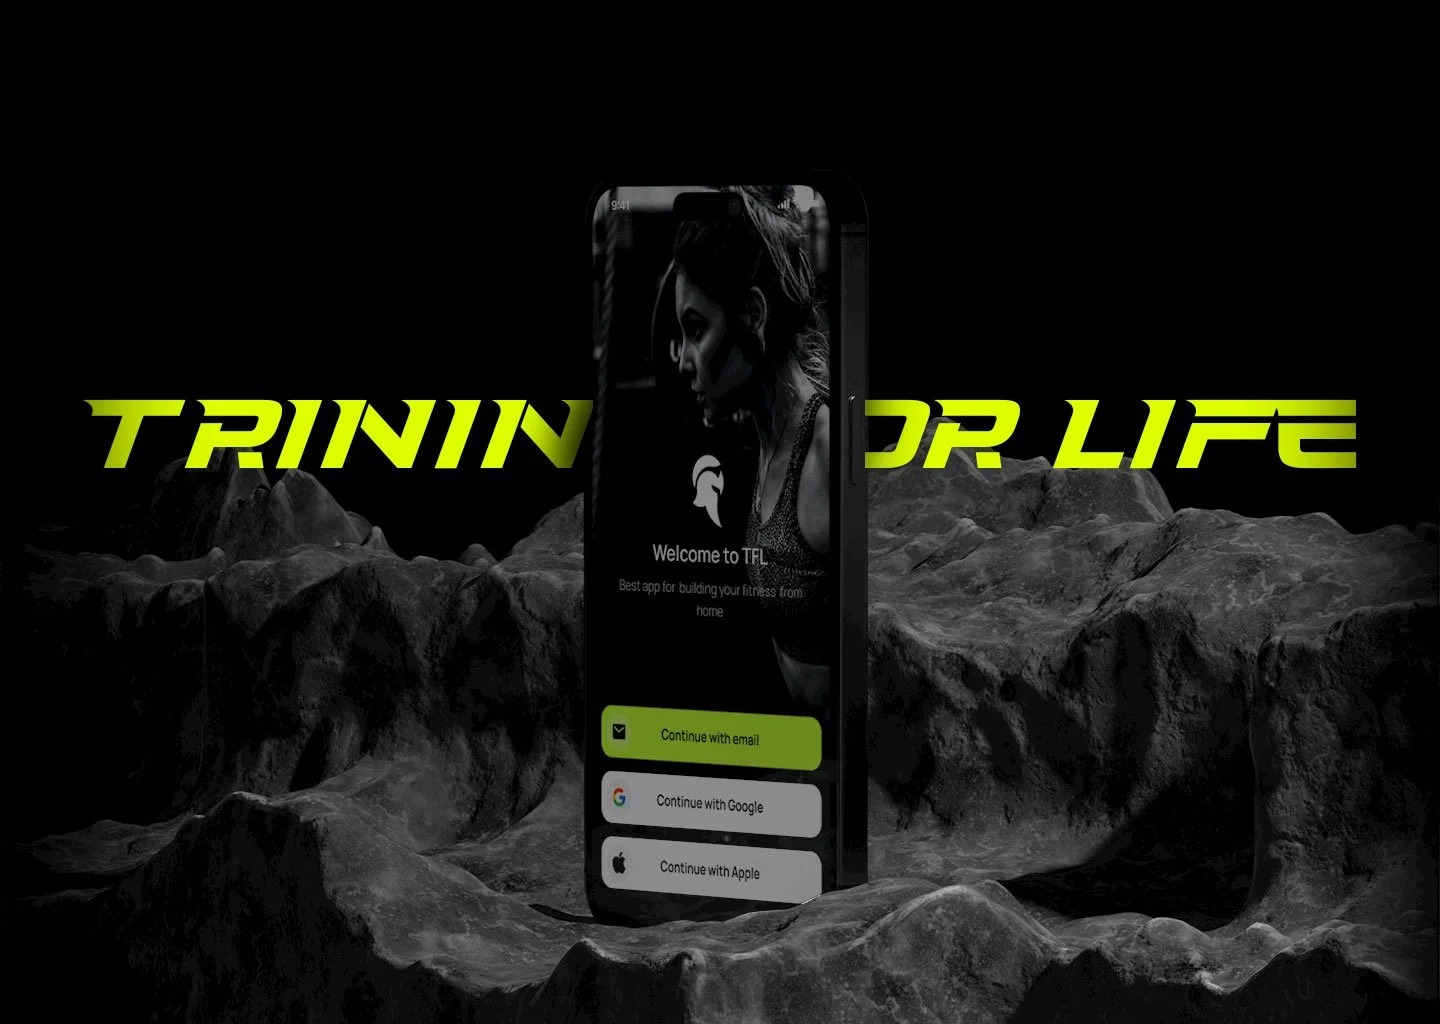
Training for Life (TFL)
ROLE
UI/UX Designer
SKILLS
End - End Product Design, Design System, Brand Identity
TIMELINE
10 weeks
Project Overview
The Challenge (Situation & Task) Despite a saturated fitness app market, high churn rates persist. Most apps fail by burdening users with complex data entry during intense workouts. My goal was to design a frictionless tracking system that maintains training momentum and boosts long-term engagement.
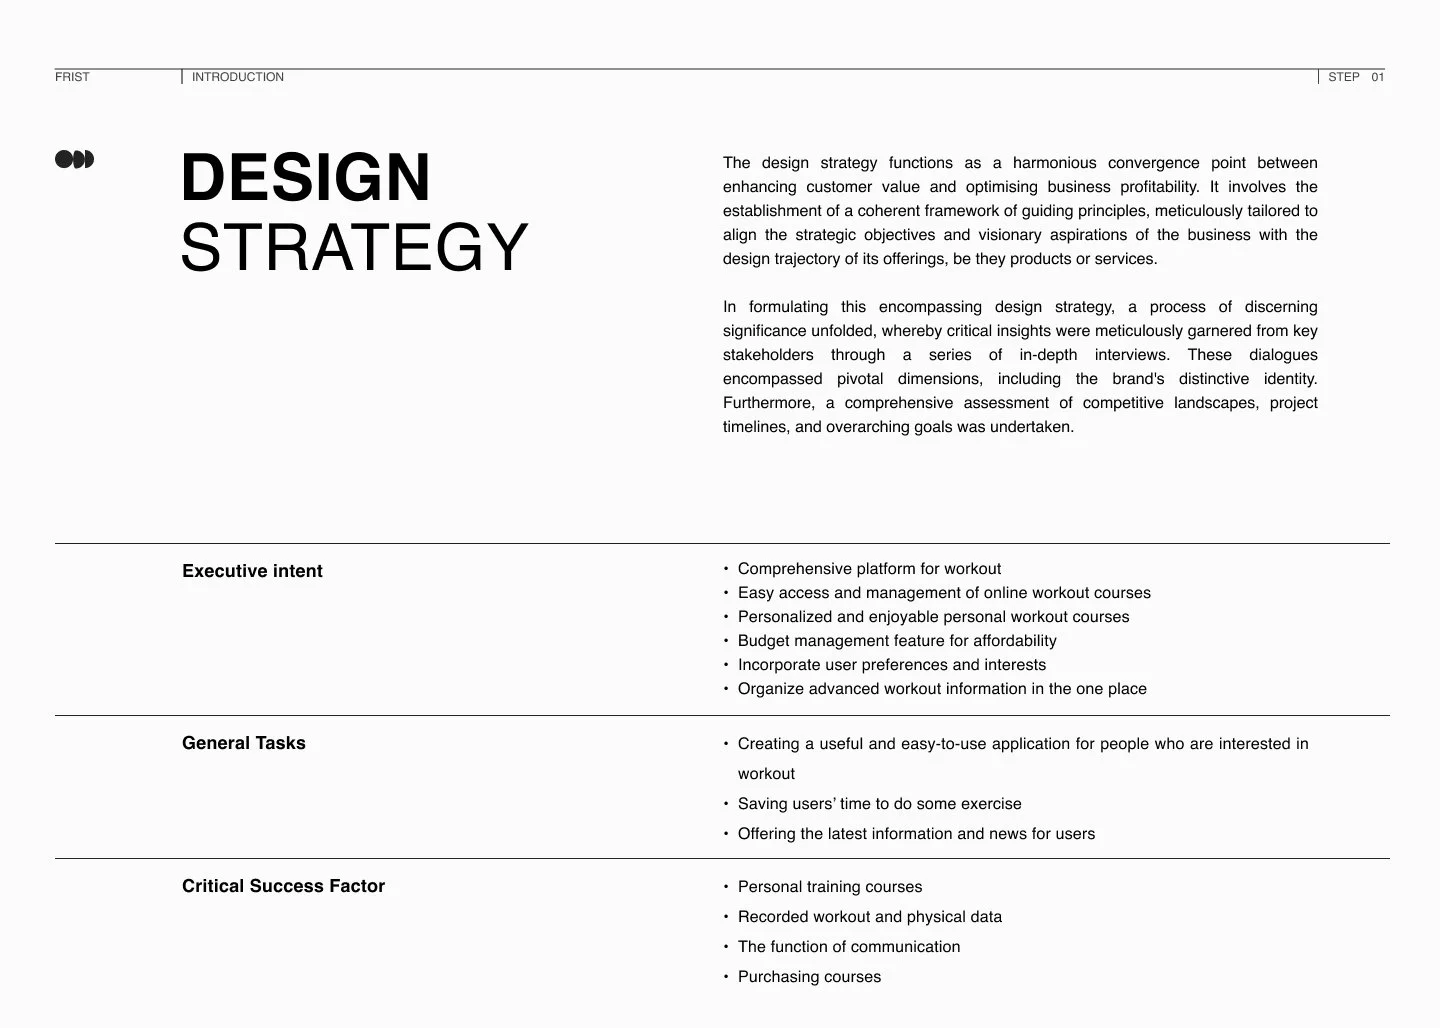
The Strategy (Action)
Audit: Conducted competitive analysis to identify navigation bottlenecks in top-tier fitness apps.
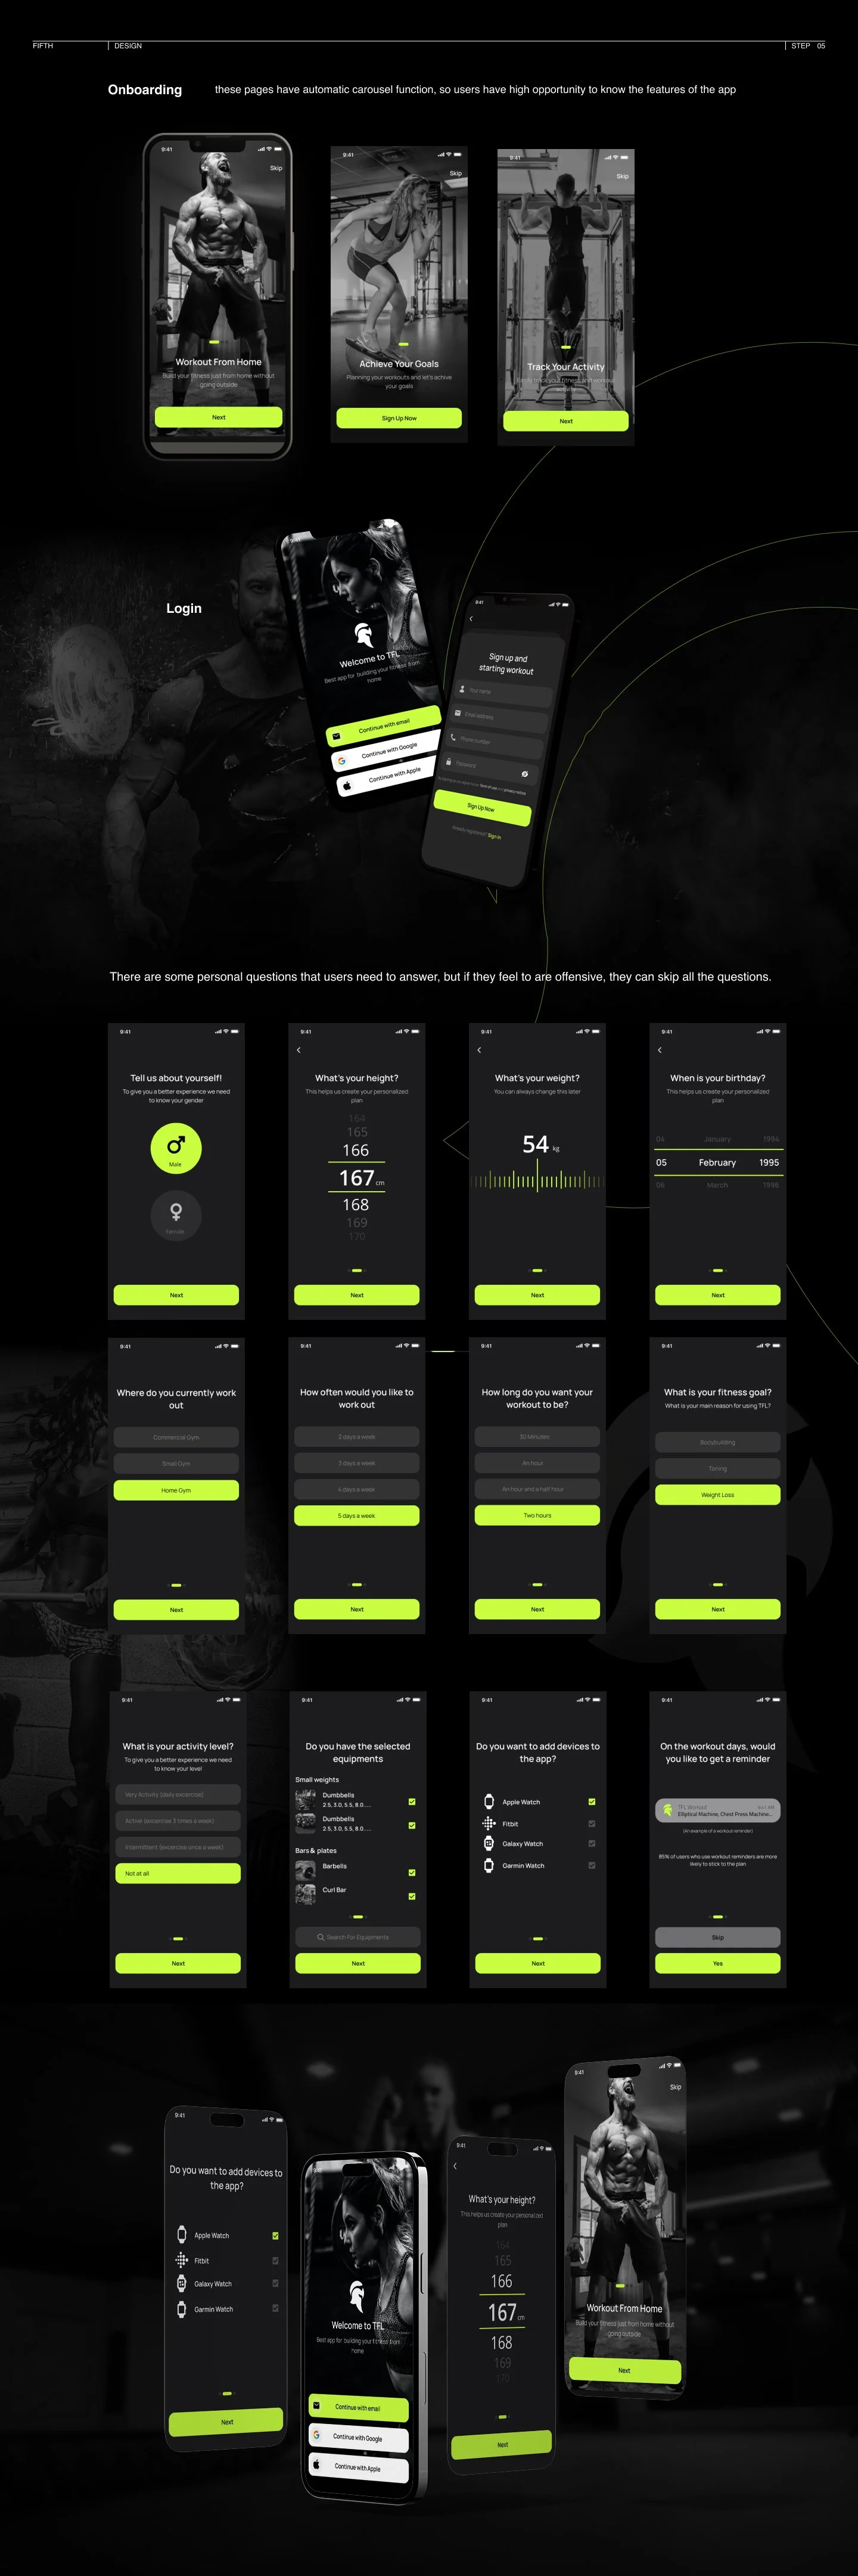
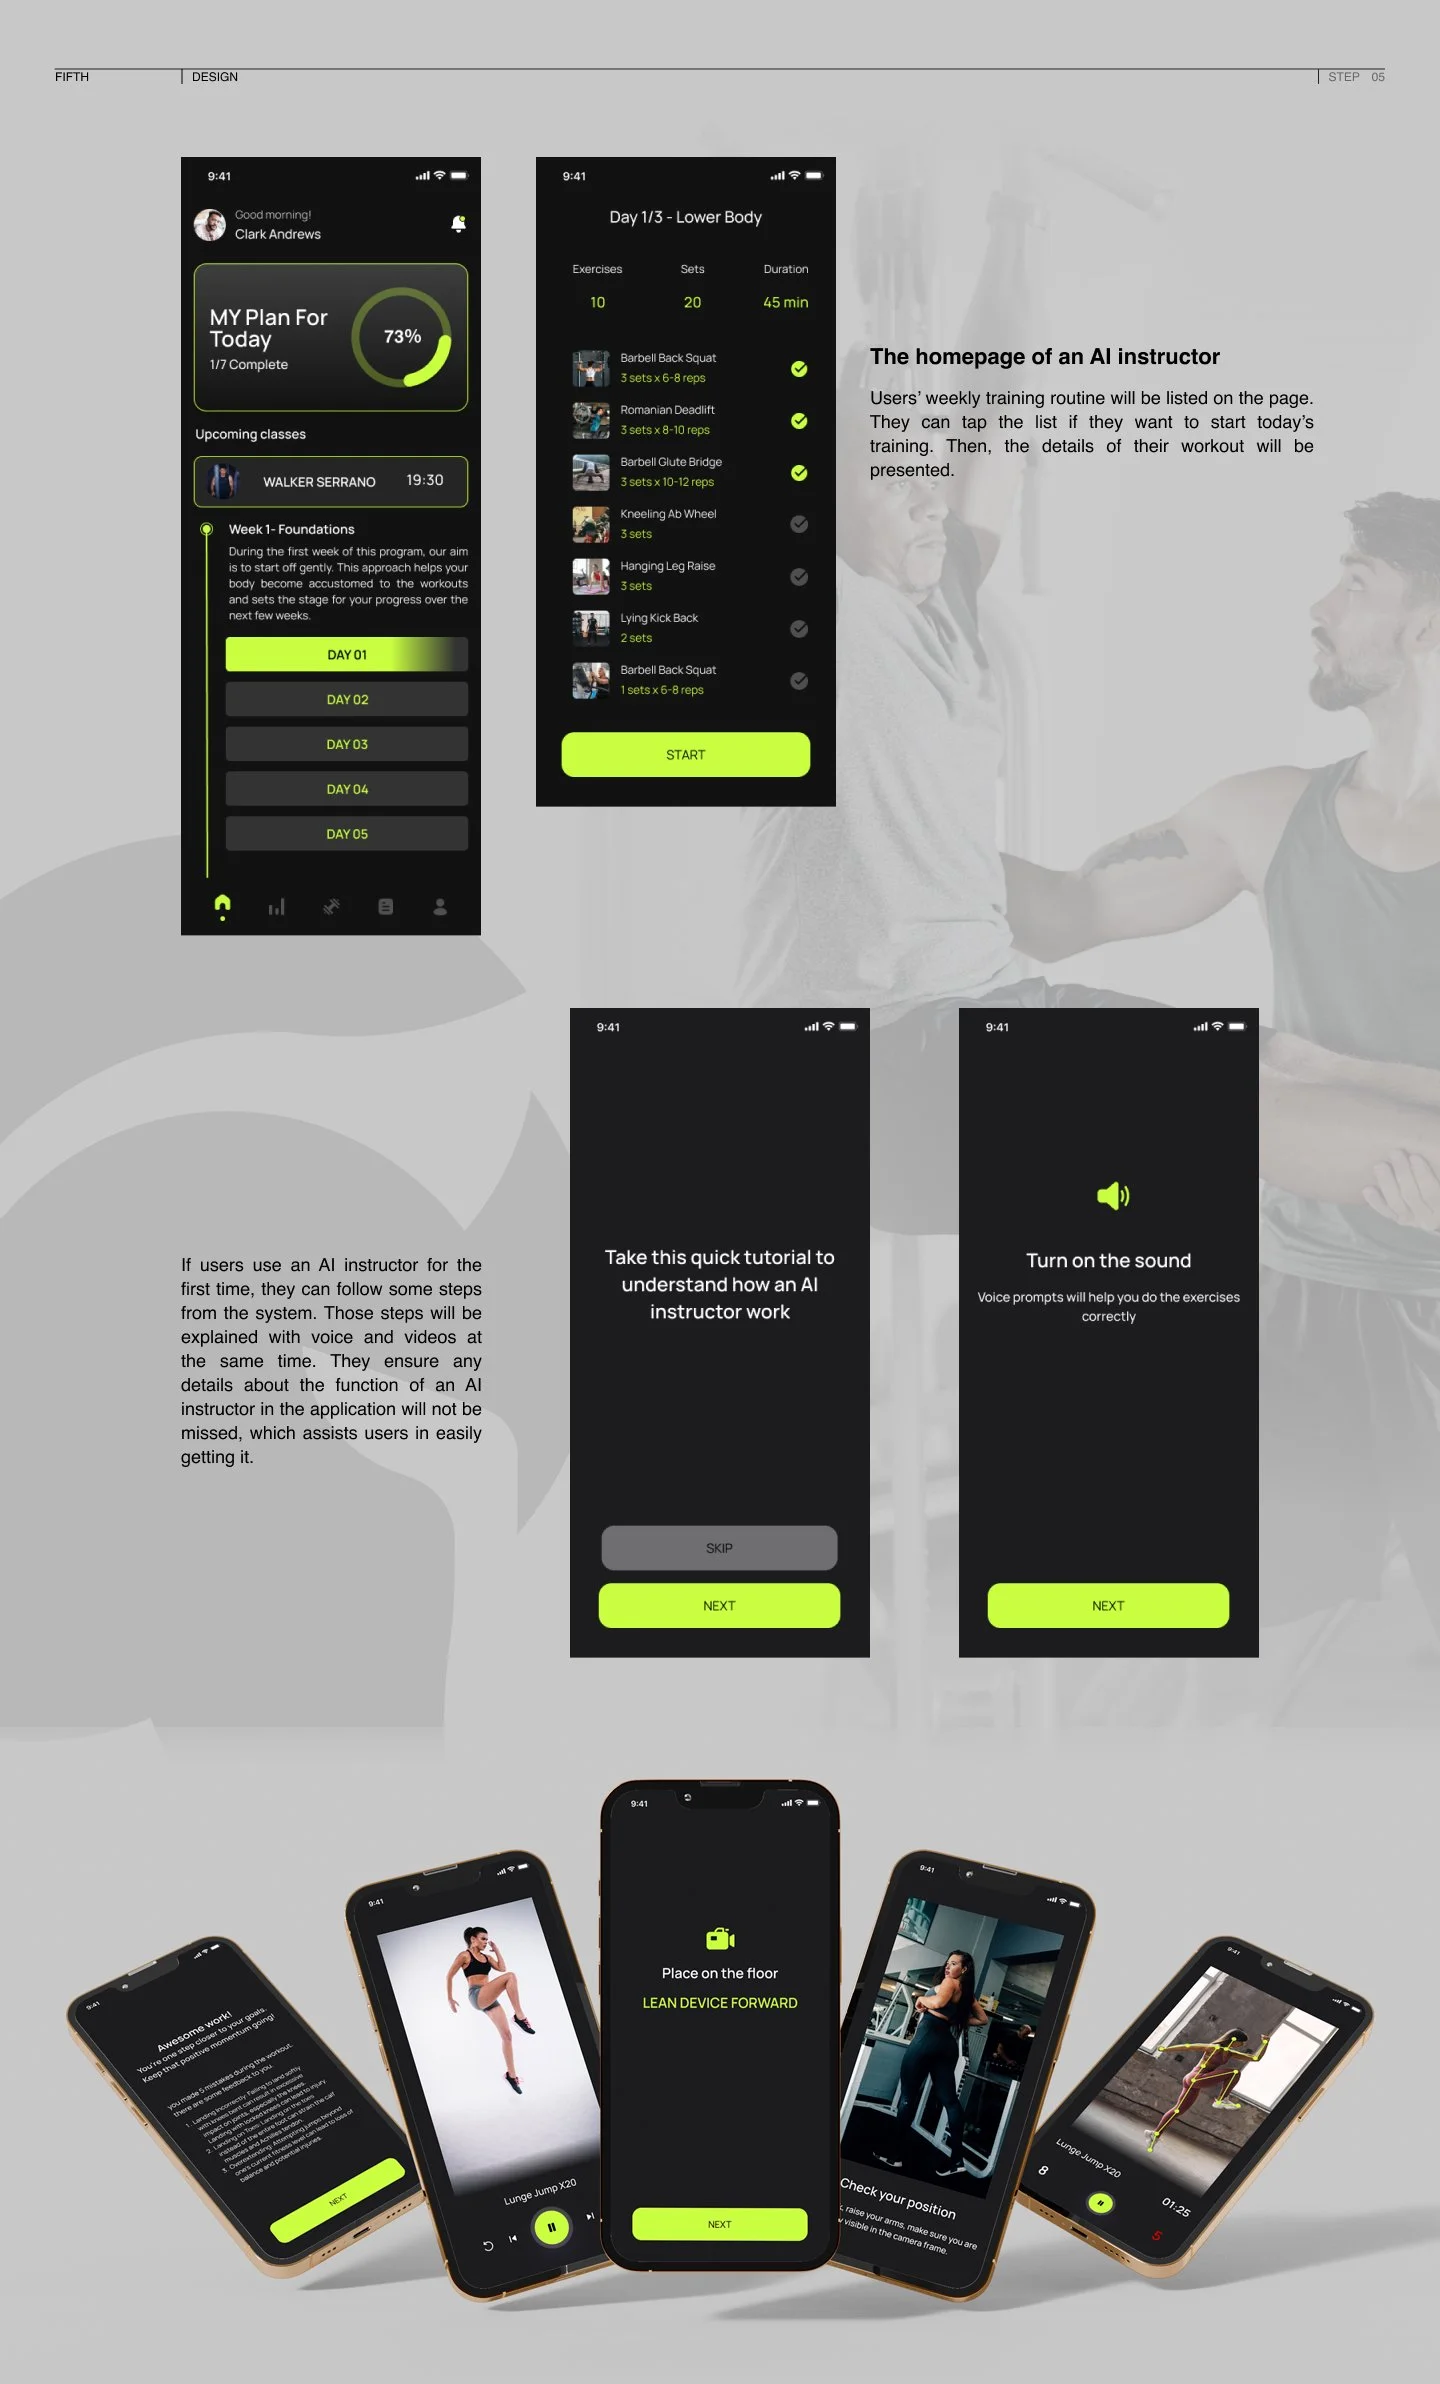
Design: Implemented gesture-based navigation and predictive data entry to minimize cognitive load.
Validate: Executed usability testing with 5 active lifters to measure task completion speed and flow satisfaction.
The Impact (Results)
Efficiency: Streamlined core logging flow by 60% (from 5 steps to 2).
User Satisfaction: Achieved a 4.5/5 "Flow Smoothness" rating during post-test interviews.
Scalability: Developed a comprehensive Design System to ensure visual consistency and 2x faster developer handoff.
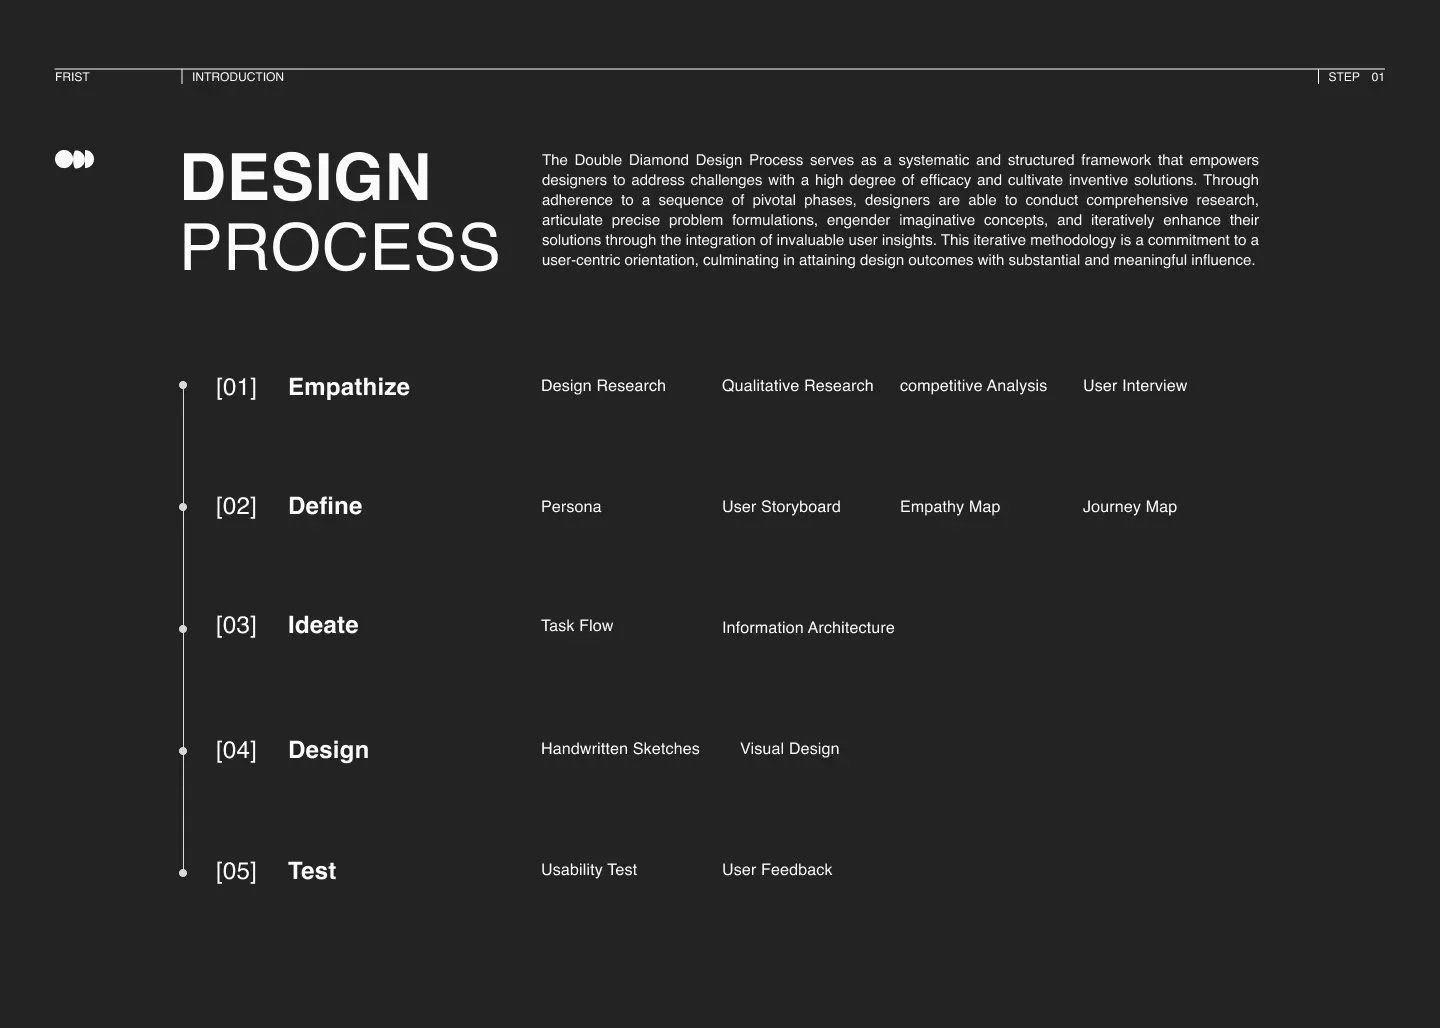
Discovery
Methodology: Utilised the Triple W (Why, How, What) framework, combining interviews, competitive analysis, and Persona analysis to define core challenges.
Action
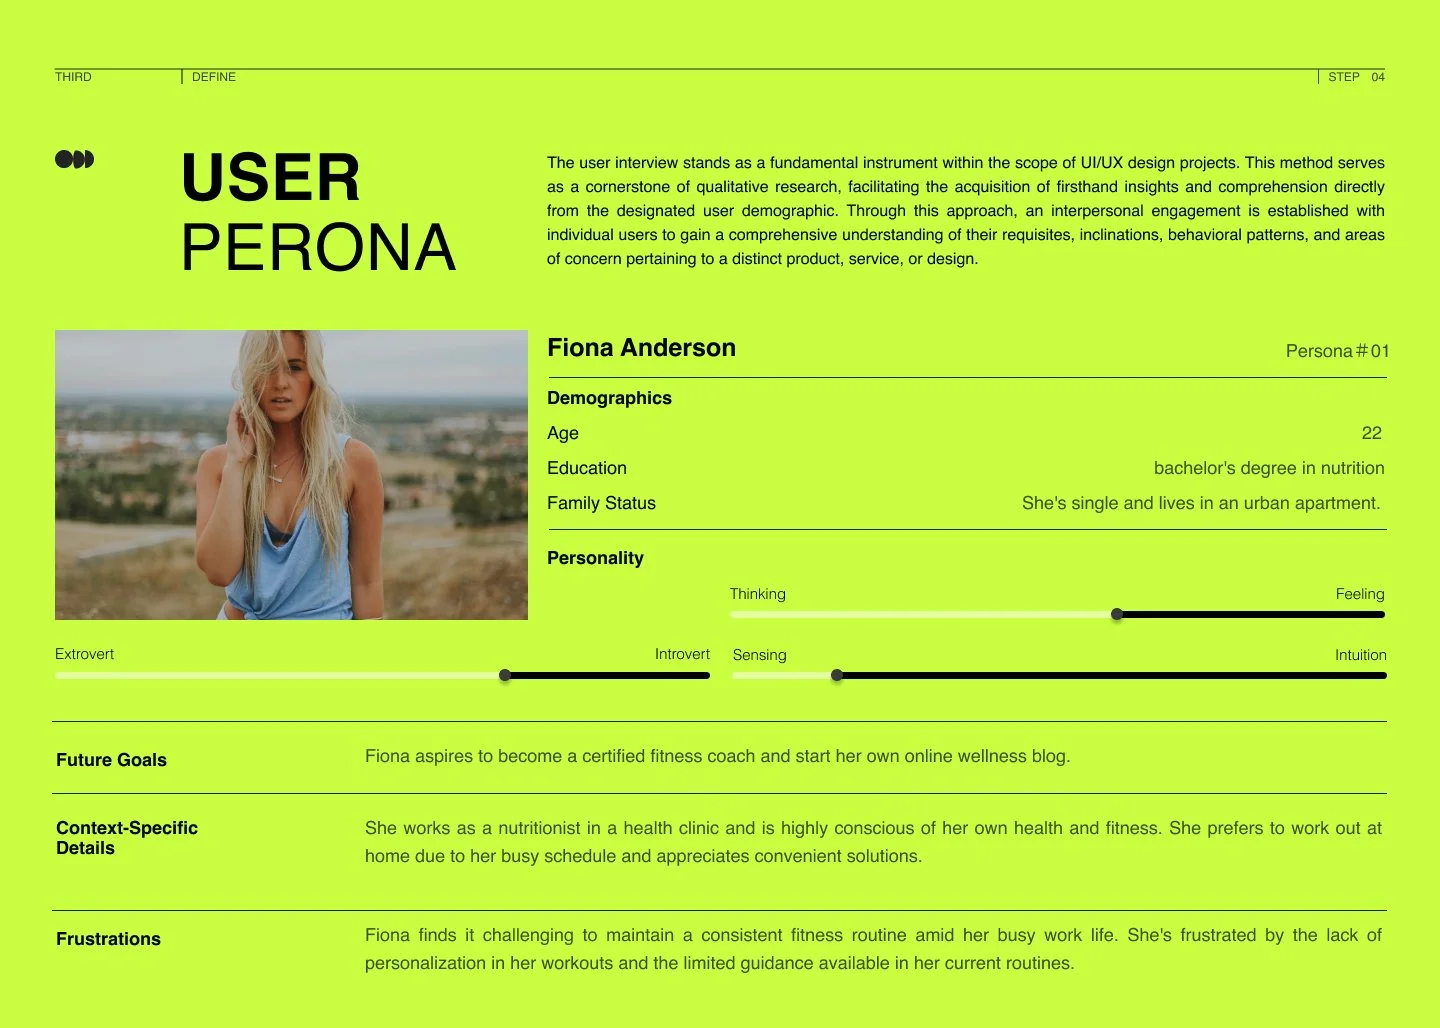
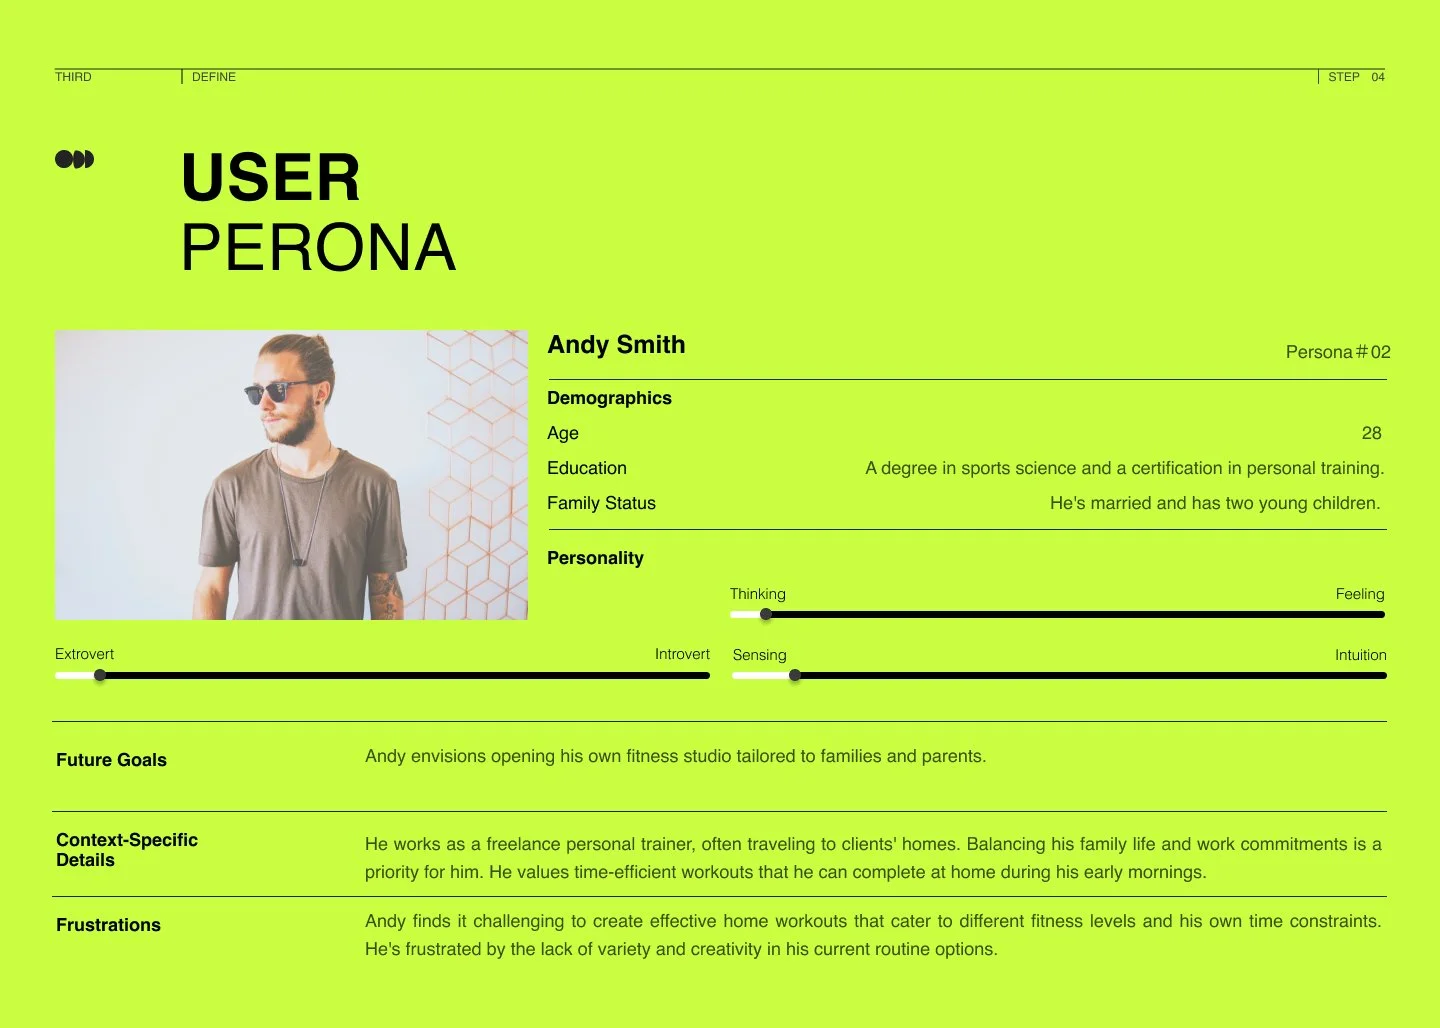
Lack of personalization and time management supports the need for customized at-home solutions.
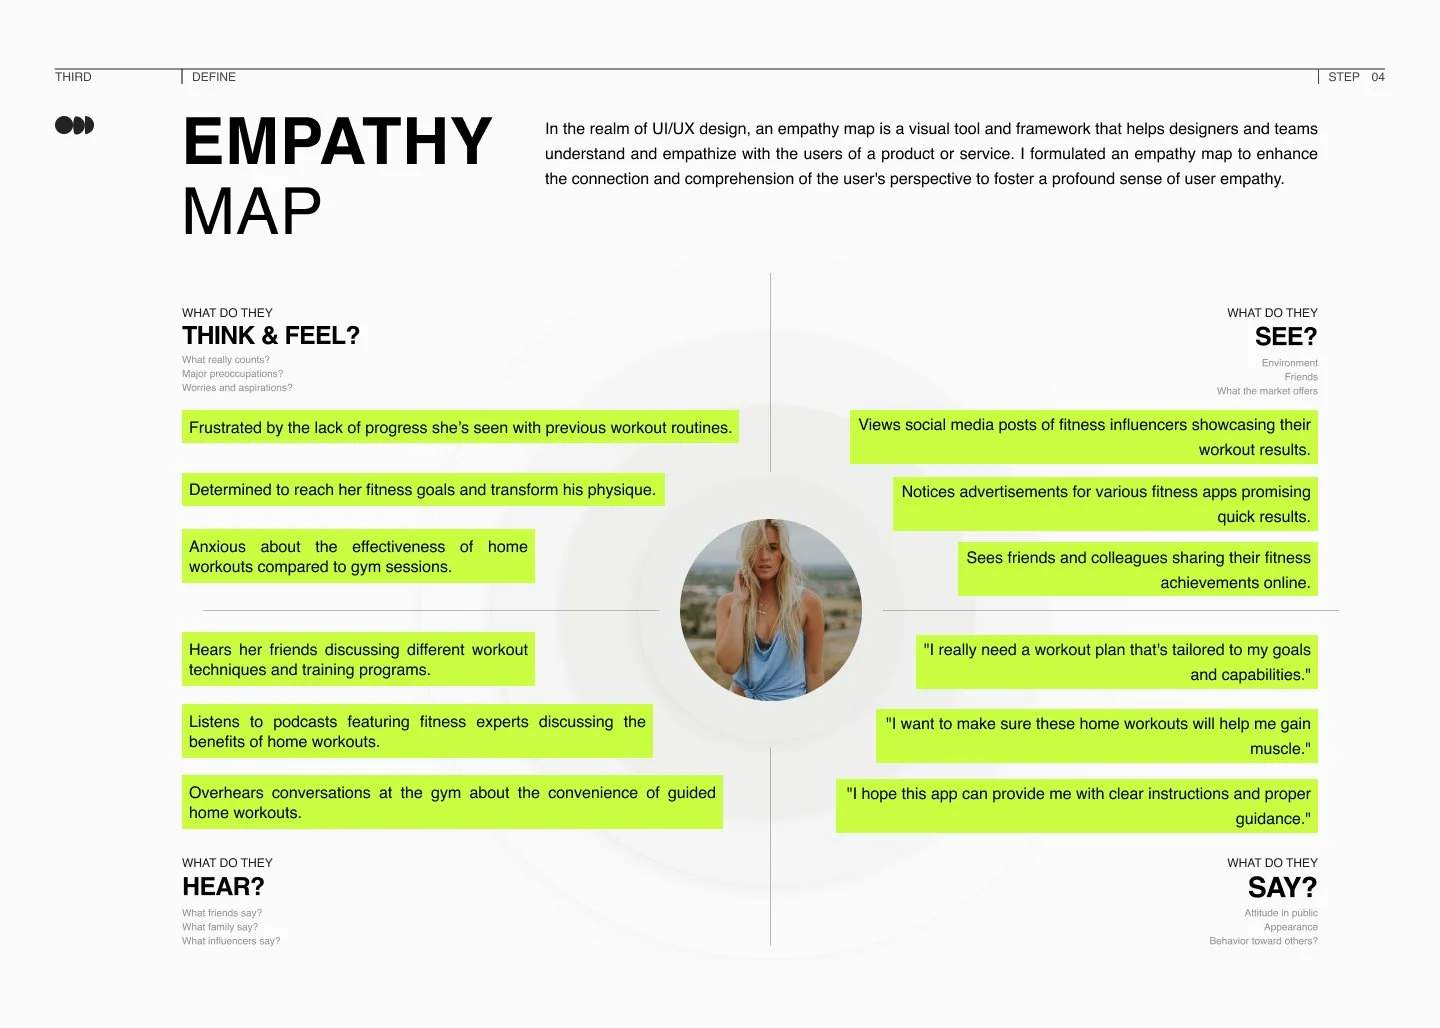
Persona (WHY)
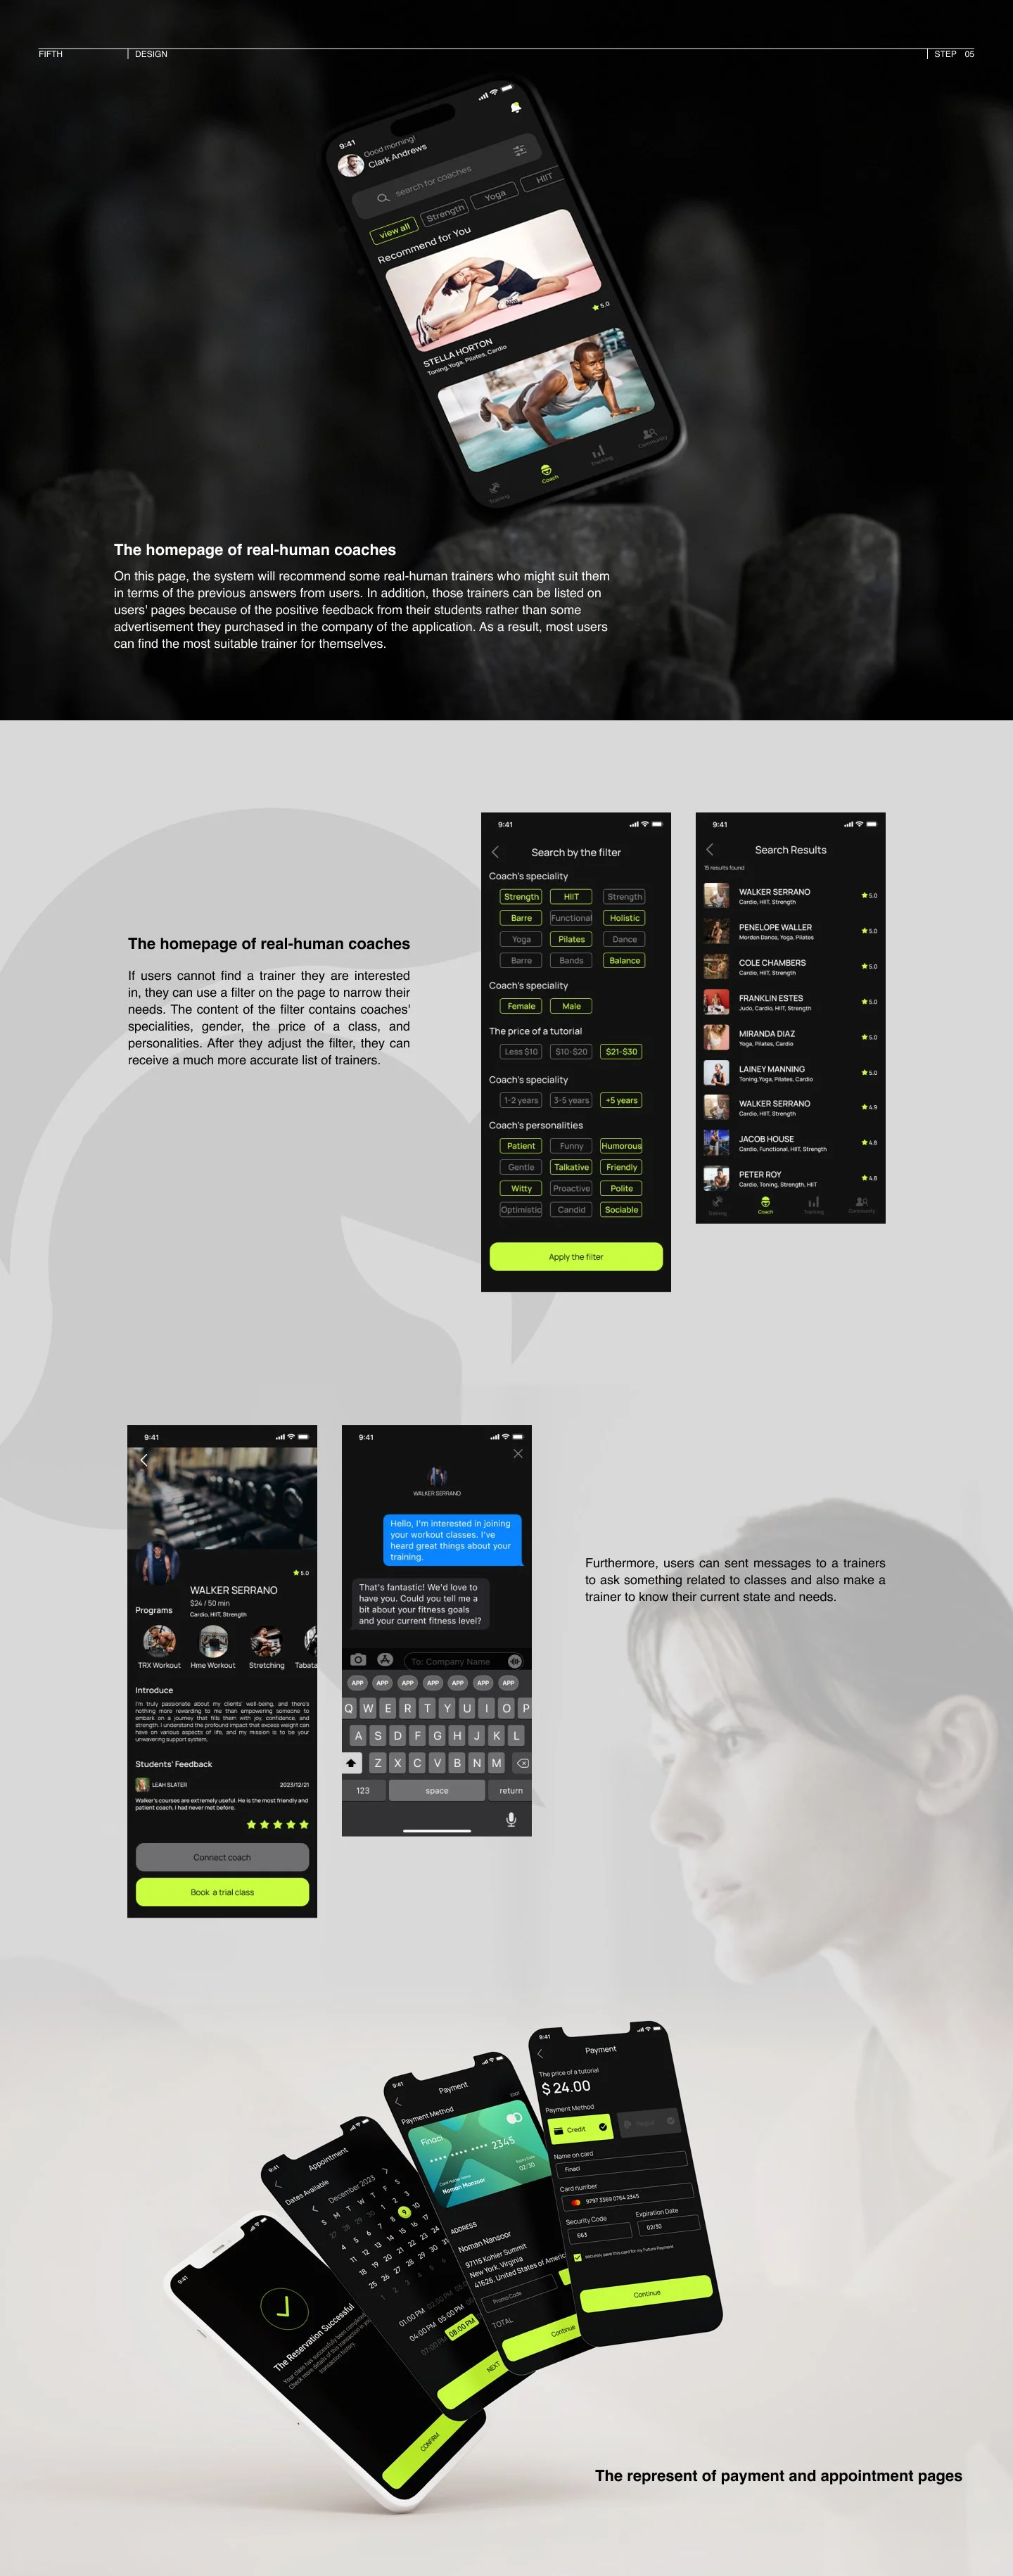
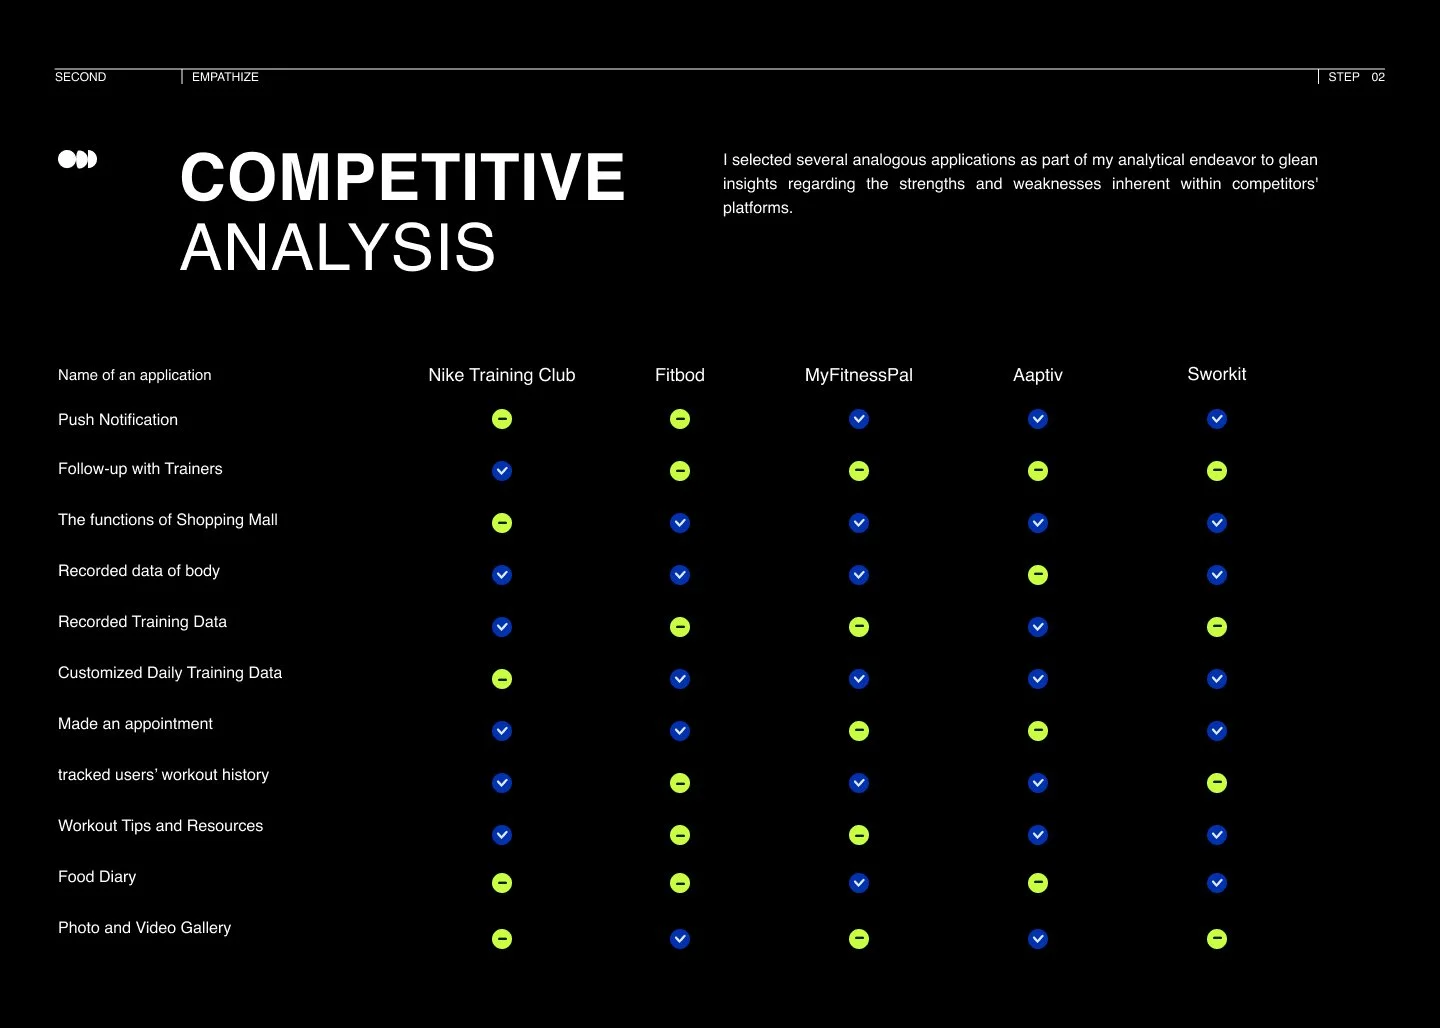
Showed existing apps lack trainer follow-up and a shopping mall, which TFL addresses with AI coaching and community.
Competitive Analysis (How)
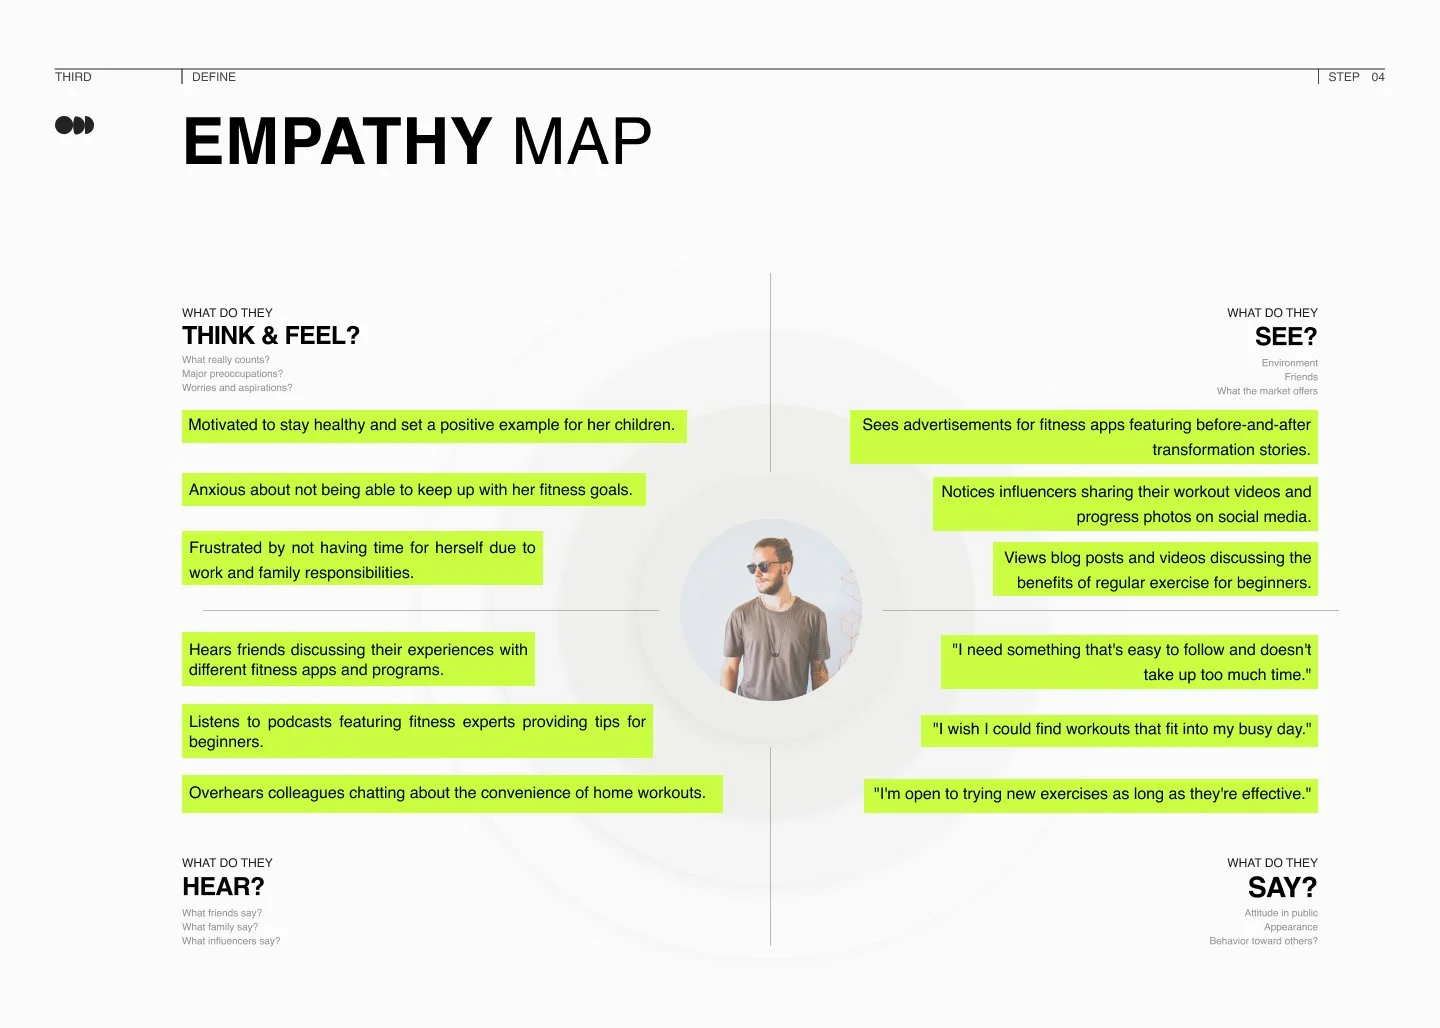
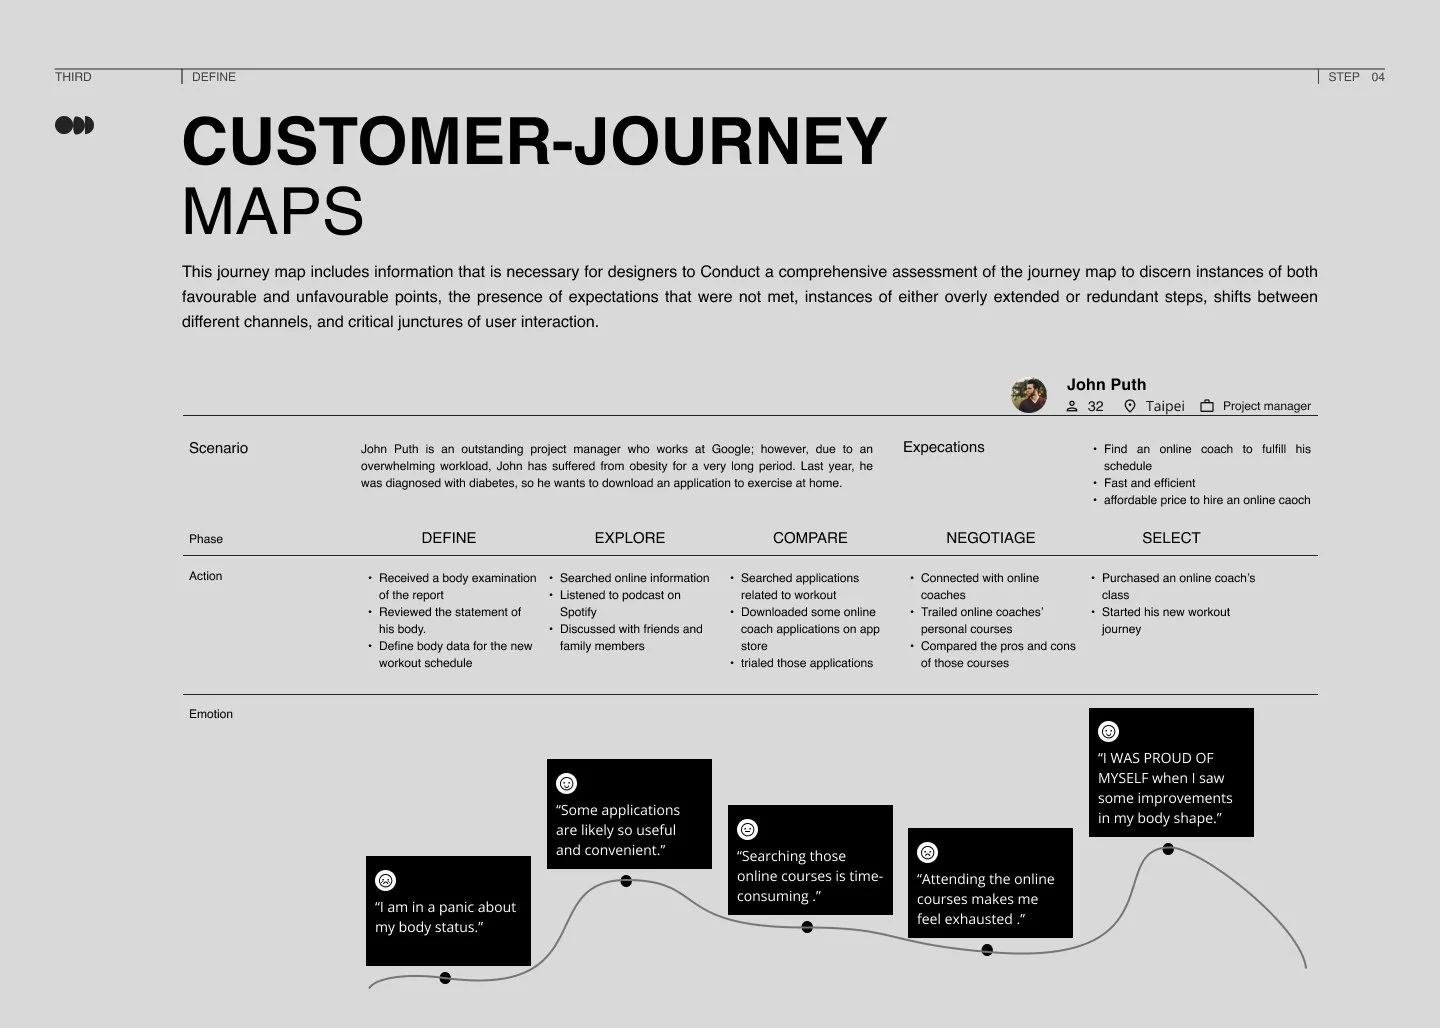
Visualized low emotional points in the user journey when struggling to find courses and maintain motivation.
User Journey
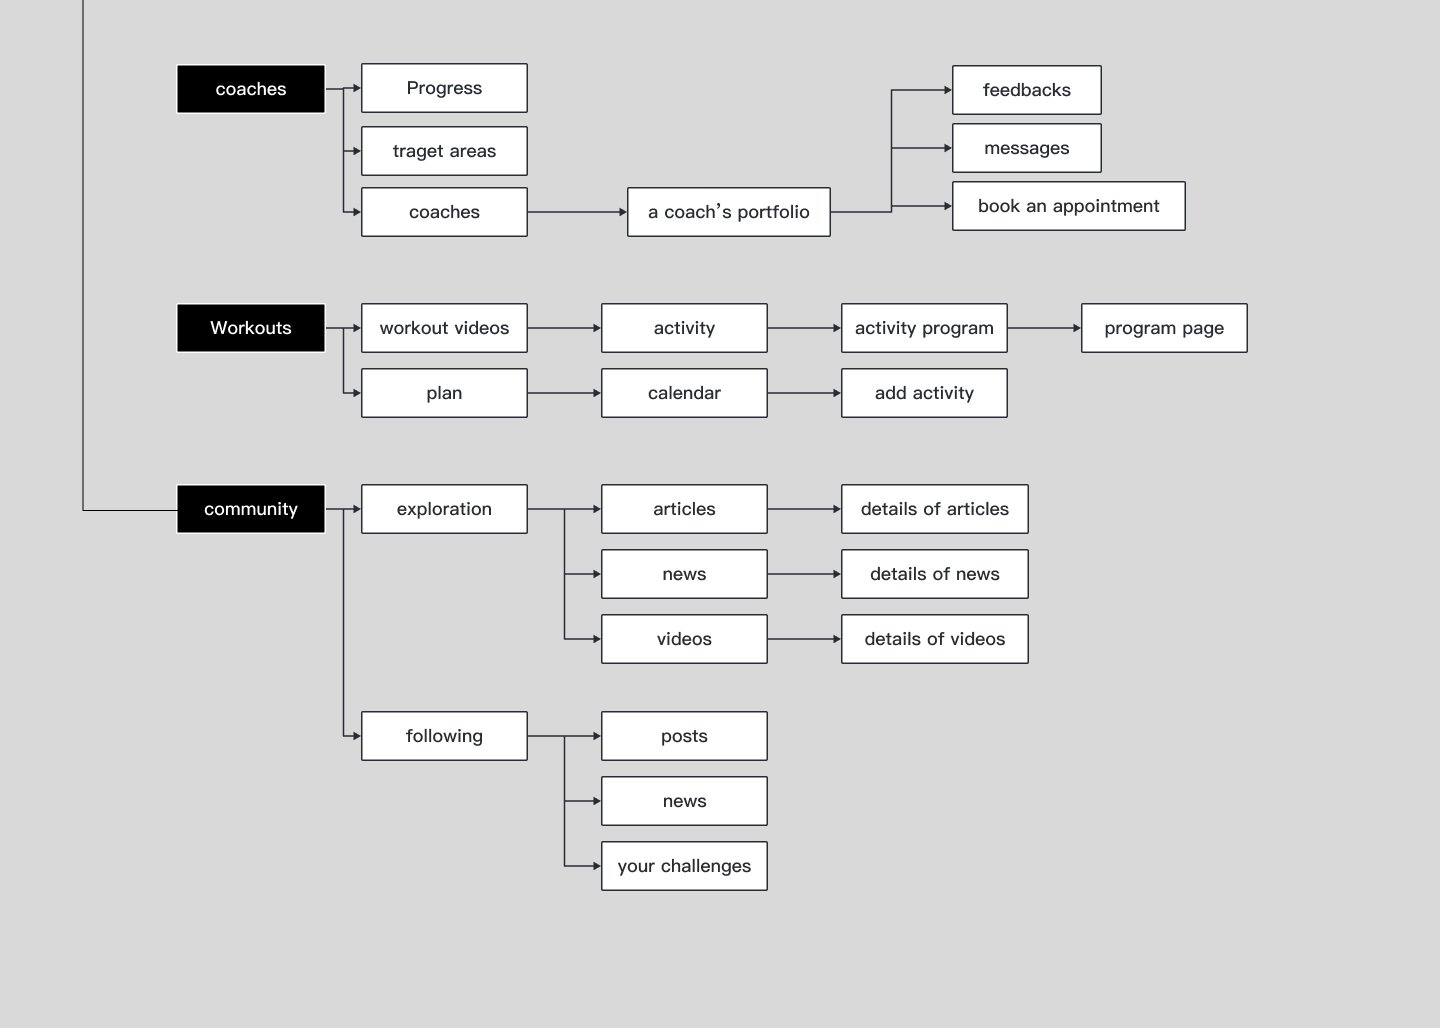
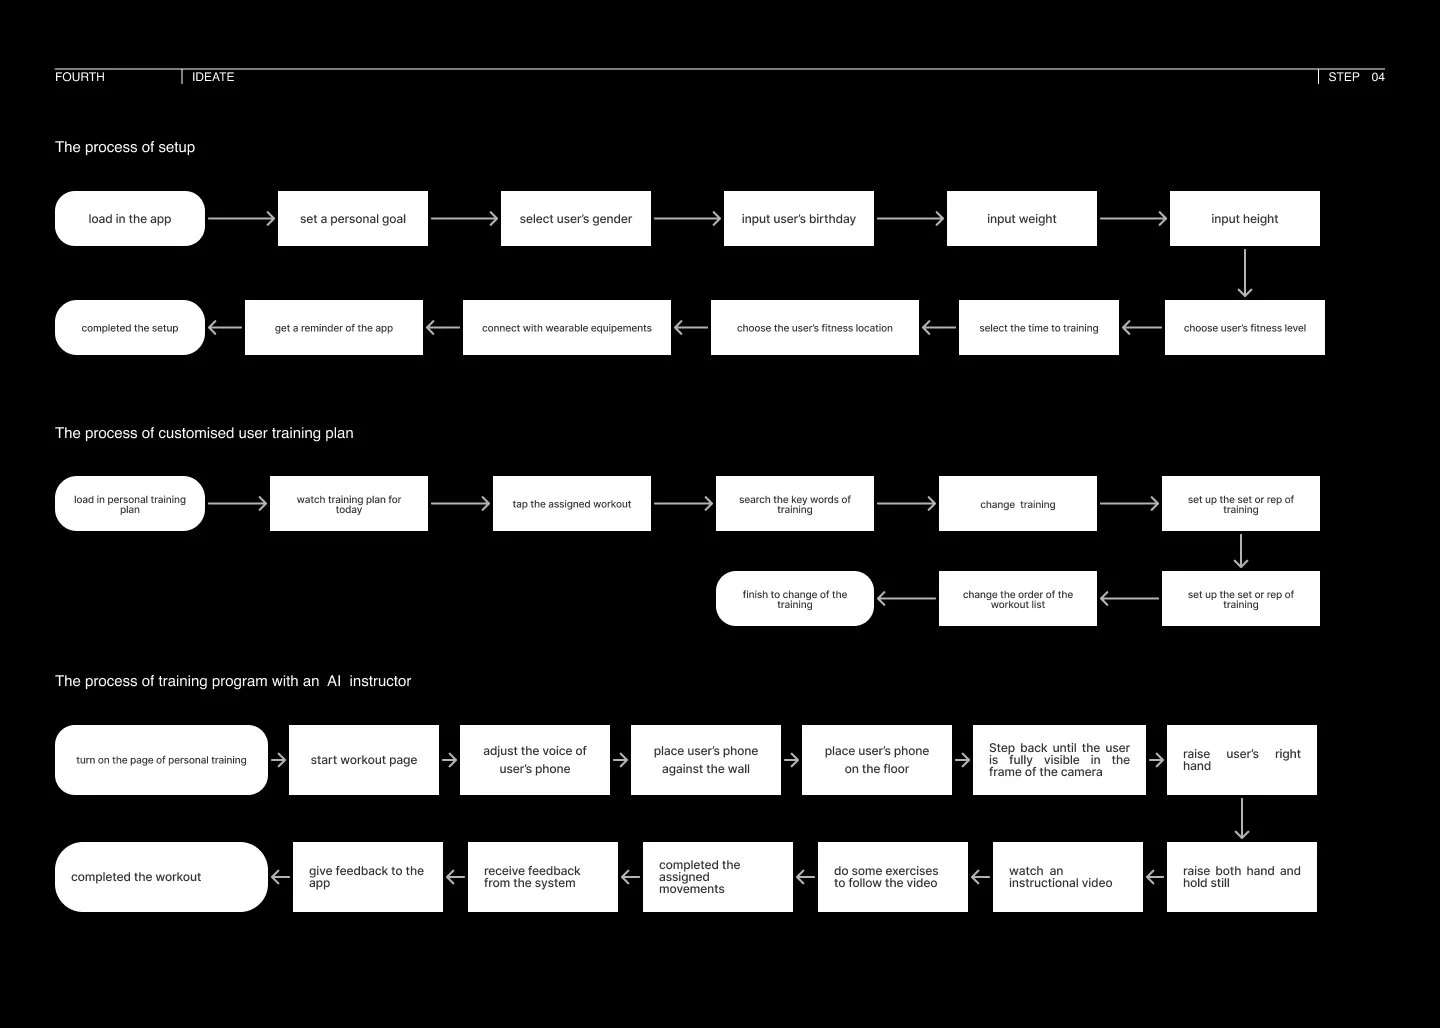
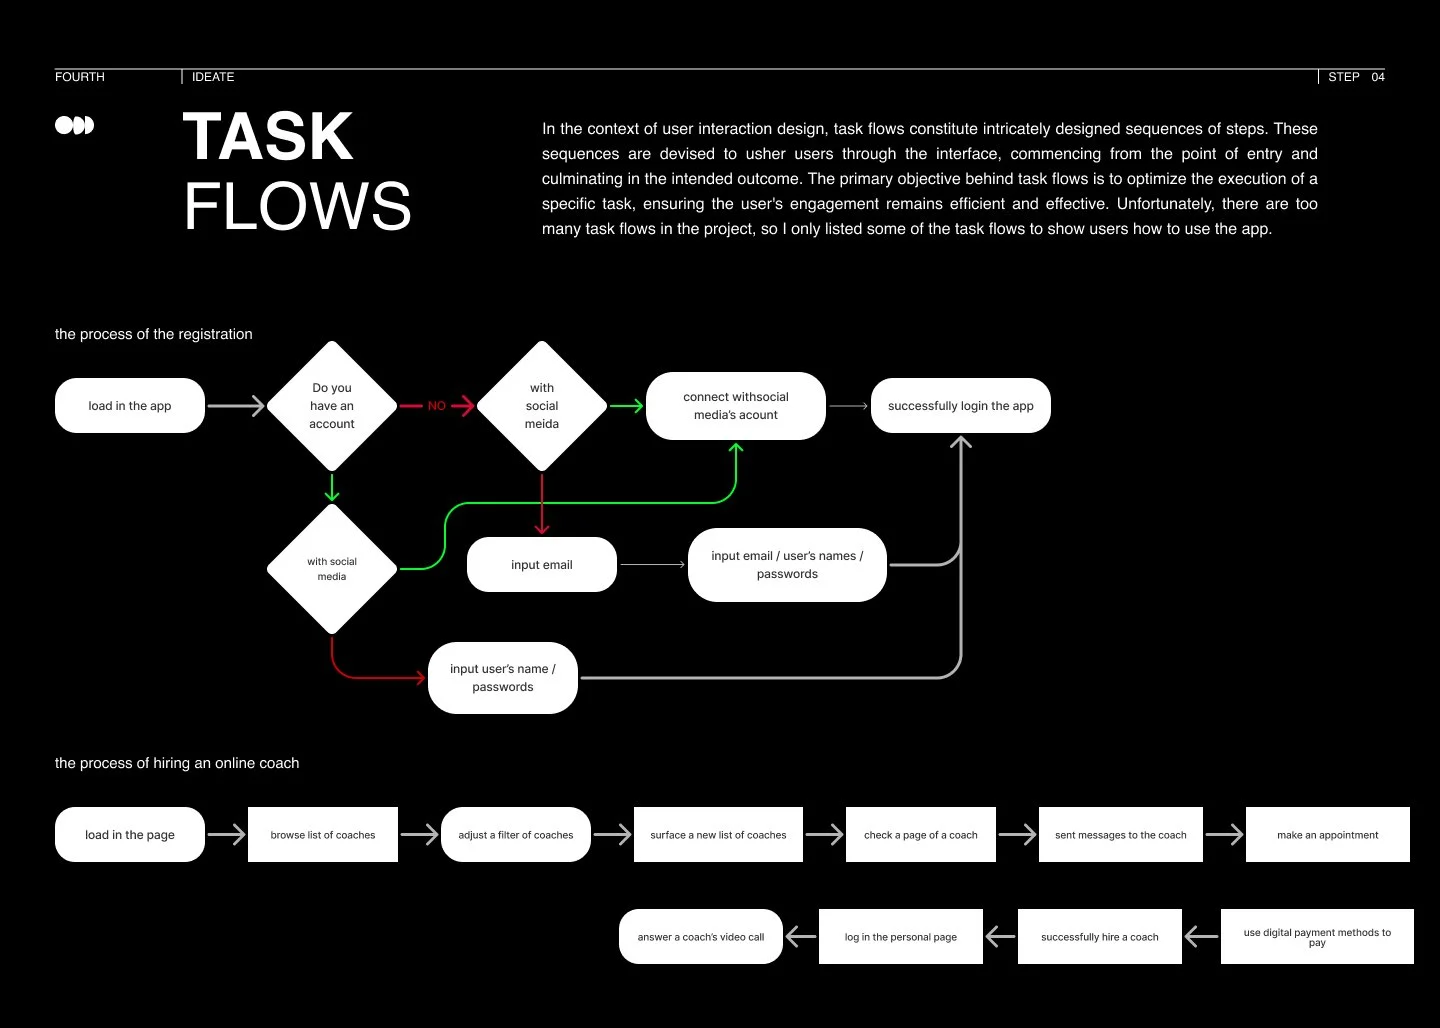
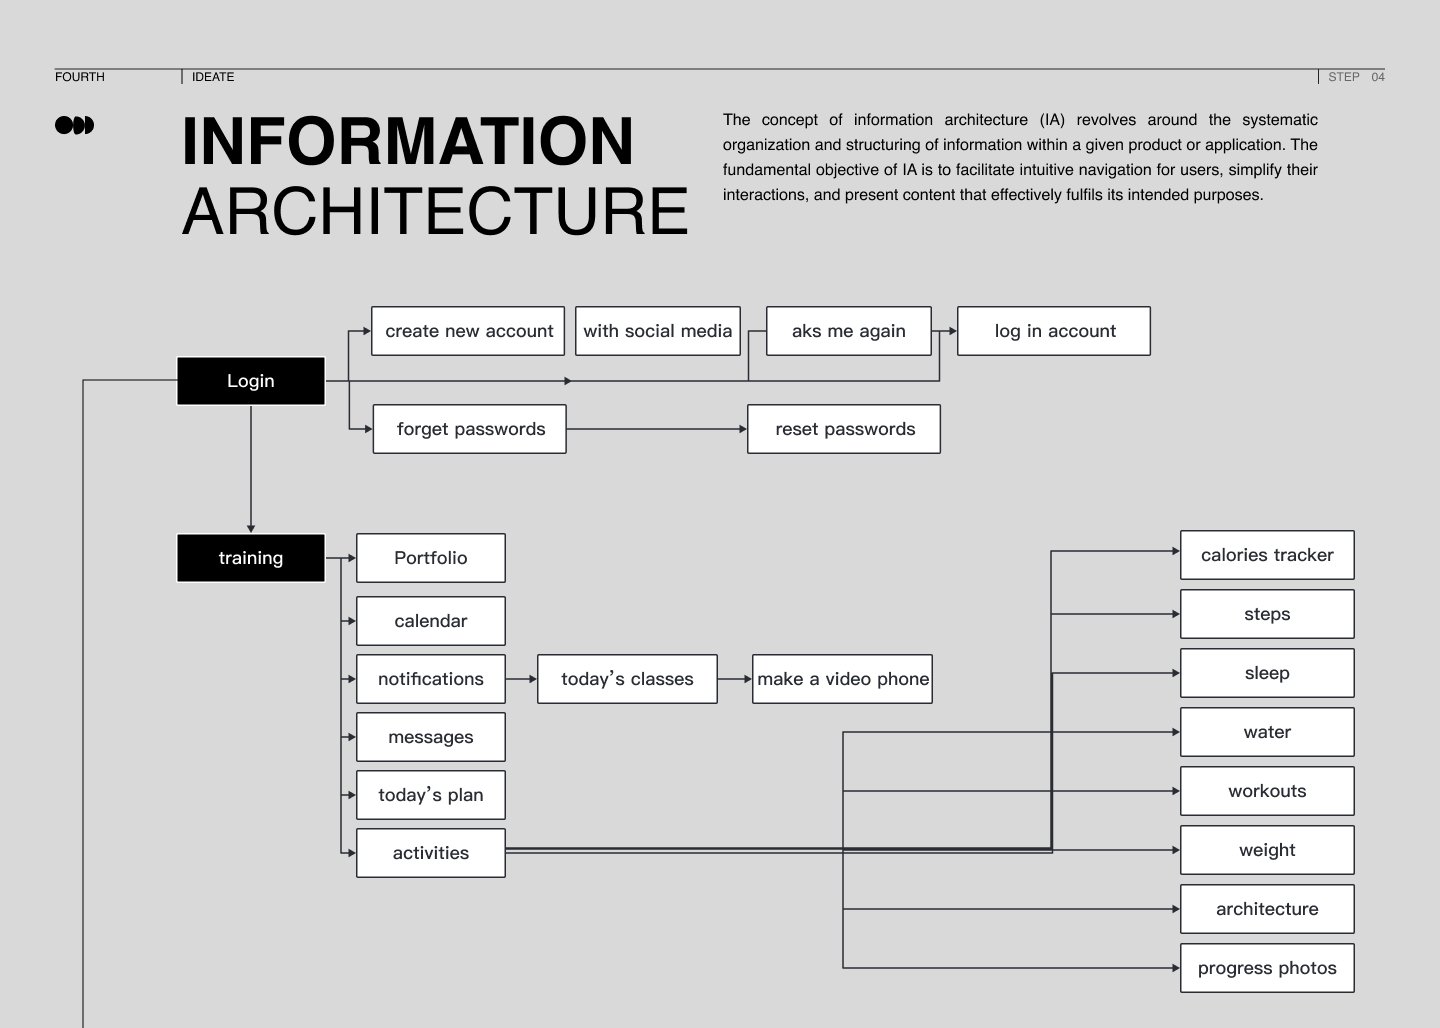
IA & Flows
Information Architecture and Task Flows served as the blueprint for the What (Deliverables) phase, ensuring intuitive navigation.
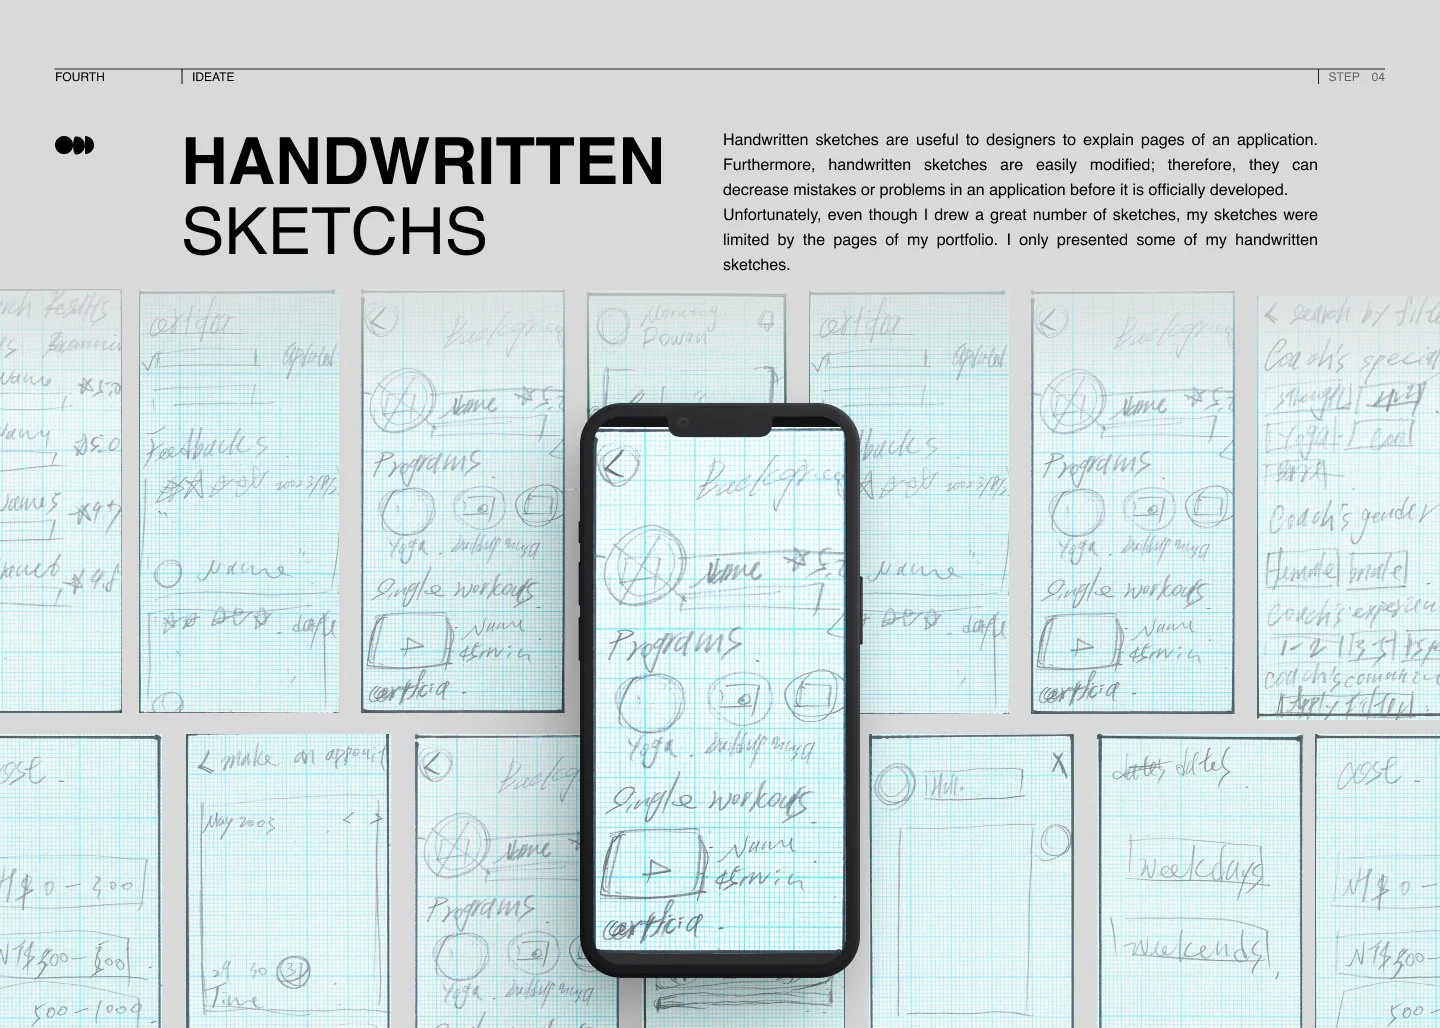
Define
Develop
Before the final Deliver stage, I facilitate a Design Review phase to synthesise feedback from user post-interviews and technical feasibility assessments from the engineering team. This ensures that any logic gaps are identified early, enabling rapid iteration to guarantee the highest quality and precision in the final product.
Design